Proficiency bands and cut scores
The standard mechanism by which standardized assessment results get reported to parents: a continuous scaled score is partitioned into a small number of named categories ("Below Basic / Basic / Proficient / Advanced," "Below / Near / Above Standard," etc.) by cut scores — numeric thresholds set by the state or vendor.
Two distinct things the bands try to do
- Communicate where a student stands to a non-technical audience.
- Anchor accountability — who is "proficient" determines school ratings, federal reporting, etc.
These goals routinely conflict. A cut score set to anchor accountability targets ("on track for college and career") may sit far above what an intuitive parent would call "doing fine." A cut score set for parent legibility may be politically uncomfortable for accountability.
Variation across systems
| System | Bands |
|---|---|
| Illinois IAR (2024 → 2025) | Bands relabeled by lowering cut scores — same labels, new thresholds |
| Smarter Balanced (SBAC) | Above standard / Near standard / Below standard, plus claim-level subscores |
| ACT WorkKeys NCRC | Bronze / Silver / Gold / Platinum — tied to % of jobs, not academic standards |
| Generic state assessments | Often four-tier: Below Basic, Basic, Proficient, Advanced |
The NCRC structure is notable for translating each band into a concrete real-world meaning ("X% of jobs"). Most academic assessment bands do not.
The Illinois case
The Illinois State Board of Education's 2025 change is a clean example of cut scores being moved to address a parent-comprehension problem. Superintendent Tony Sanders argued the prior cut scores were "among the highest in the nation and confused parents because they were not aligned with grade level standards." The fix: lower the cut scores so that statewide ELA proficiency jumps from 39.4% to 52.0%.
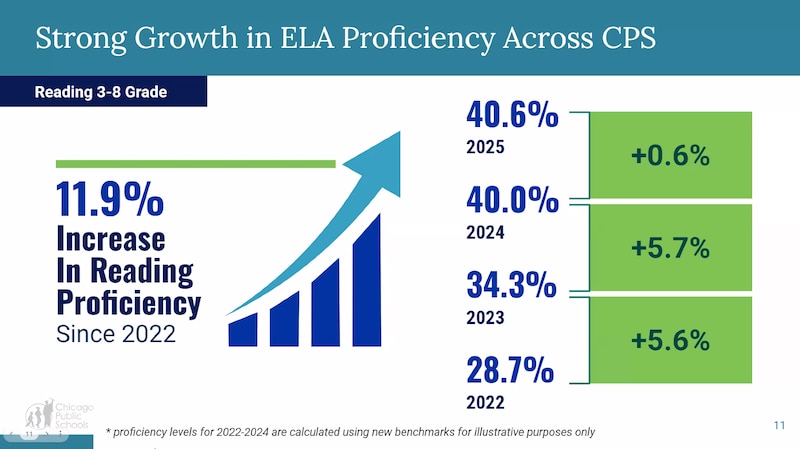 CPS retrospectively applied the new cut scores to prior years to make the comparison ISBE didn't publish. Source: Chalkbeat coverage; image attributed to CPS.
This addresses one form of confusion (the gap between "at or above grade level" intuition and the previous proficiency rate) by creating another (the same labels now mean something different than they did last year, with no comparison data published).
The deeper problem
Bands are an interpretive layer, not a measurement. A parent who learns their child is "Approaching Standards" still doesn't know what their child can or cannot do, what comes next, or what the score implies for college, careers, or specific competencies — unless someone has mapped the band to those things. That mapping is usually missing.
The SBAC × PTA 2022 focus groups found that adding claim-level skill breakdowns ("above / at-near / below standard" across three sub-concepts) underneath the headline band did not solve this — parents "liked the specific skill identification but questioned how to make this information actionable" and struggled to reconcile the sub-scores with the overall scaled score. More granularity within the band paradigm produced more confusion, not less.
A different mechanism: scale-only growth (no bands)
Some assessment vendors deliberately avoid the band paradigm. NWEA's MAP Growth reports a continuous RIT scale-score plus a percentile and a growth percentile, with no proficiency bands at all. The framing is "is this child growing at a healthy rate?" rather than "is this child proficient?" That sidesteps the cut-score and band-label problem but introduces its own: parents have to interpret a numeric scale (e.g., RIT 215) with no intuitive anchor, and NWEA's own family-facing guidance is built almost entirely around comparing one number to another (norm groups, percentiles, growth) rather than translating the number to anything in the world.
So the landscape currently offers three patterns: bands with cut scores (most state tests), scale-only with norm comparison (NWEA), and bands tied to real-world meanings (NCRC tiers). Only the third explicitly closes the meaning gap — and only at graduation age.
See perception gap for how this manifests in parent behavior and Portrait of a Graduate for a competing framing that bypasses bands entirely.